Project · #05
Version status
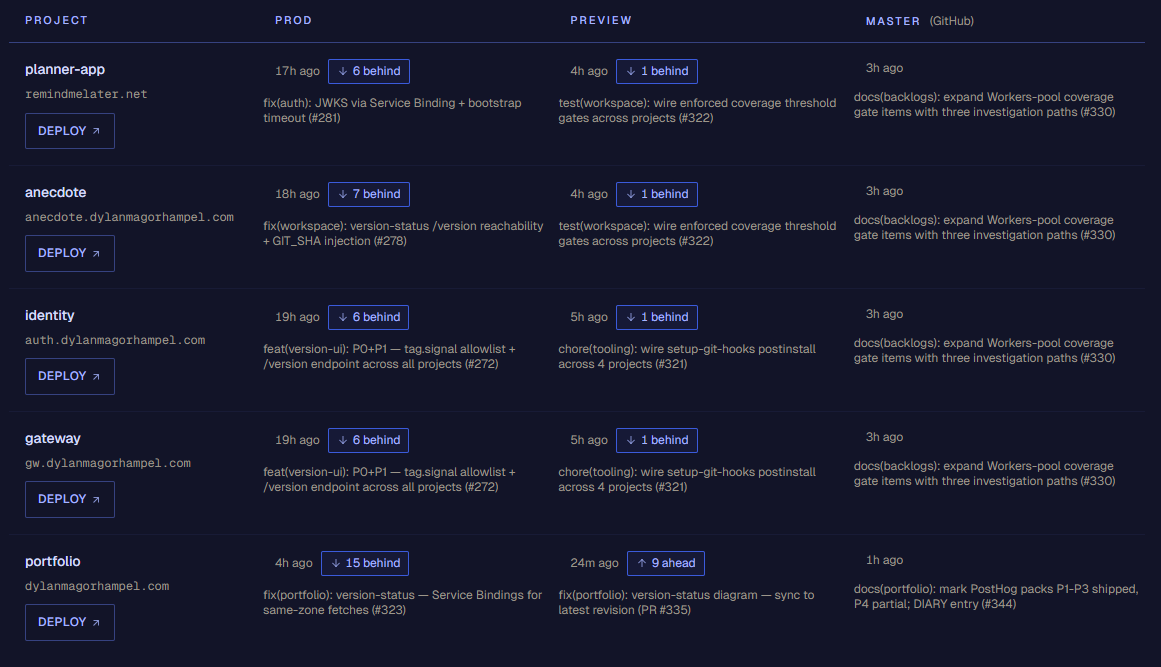
A dashboard showing where every project sits across prod, preview, and master. Idea to deploy in a day.
View liveWhy I built this
Playing with Claude Code over the past month, my little personal tech ecosystem has escalated to three full-stack apps and two backend services, each with preview and production environments. I keep forgetting to deploy to production. Environments drift out of date relative to master. I keep causing myself confusion looking for features that aren’t there.
The other day I realised I could put together a quick dashboard showing each environment’s version and its drift from master. So I did. Over a Saturday evening, between family dinner, playing with my son, and putting him to bed, I shipped a dashboard that surfaces every project’s version state at a glance.
UI design (30 min elapsed · 3 iterations)
I knew I wanted a simple table-based UI, extendable to add more projects later. What I wasn’t sure about was the table’s shape. I leaned on Claude Code to visualise it, and went through three iterations.
These days, my design workflow with Claude Code is mostly Claude generating HTML mockups using my design system components and tokens. I don’t have a Figma step, or any separate design tool. It’s just Claude building mockups from my instructions, and iterating on them directly. When it comes time to implement, the mock is already real UI code, so getting a matching implementation is easy.
v1 was Claude’s first cut from the requirements I gave it. In v2 I reordered the columns to put the most important first, introduced a violet highlight for cells that need attention, and stripped commit SHAs to declutter. In v3 I dropped the dedicated Deploy column and merged it into the project column (production deploy needs a manual click; everything else is automated). Thirty minutes of iterating on the mock made it easier to reshape the design before it was implemented in code. Going straight to build would have been more difficult, and would have over-engineered the backend for data I didn’t end up needing.
Plan then build (45 min elapsed)
Implementation planning was mostly driven by Claude Code, with a bit of back-and-forth to refine the details. We landed on each app populating an environment variable with the GitHub commit hash of its live version. This gets set on each deployment, as part of the GitHub Actions pipeline. Each app exposes a /version endpoint that returns the hash. Finally, a Cloudflare Worker orchestrates the whole thing: calling each version endpoint, fetching commit history from the GitHub API, and stitching the results into the response the frontend renders.

Iterate and polish (1 hour elapsed)
After deploying, most of the data wasn’t loading. A quick investigation turned up some gaps in how the environments connected, hard to foresee in the planning stage. Easily fixed in about 20 minutes.
I also saw that the calculation for commits ahead and behind was off. I’m using a monorepo, and Claude had missed the logic to filter the GitHub API calls to each project’s path, so it was counting every commit against every project. Again, a quick fix, with a bit of care to avoid blowing through the API rate limits.
Finally, a few UI polish improvements here and there. For example, making the table scrollable on mobile.
With that, it was done. From idea to released in just 3 hours on a Saturday night, while juggling family dinner and some pre-bedtime play with my 14-month-old.
Later improvements
Since then, I’ve continued to build more onto the dashboard - it’s been super helpful to have one place to go to find the status of all my apps.
I’ve added a status bar tracking my projected github actions usage. Actions is Github’s CI/CD platform for running deployment jobs etc. I ran into an awkward scenario in April where I had automated deployment on every code merge, and burnt through my plan’s included actions very early. The status bar helps prevent me running into this problem again in the future.
I’ve also added direct deployment links to the authenticated version of the page (that only I have access to). This means I can deploy selected branches to any environment without even leaving the page.